(5) "HyperCube", Balanced Data model of the NoSQL era
The last article was about collecting and storing COVID-19 relevant datasets (Johns Hopkins University Datasets), and cleansing any inconsistencies of the data within. With the cleansed datasets at hand, this article will show how to analyze datasets using the pivot chart, and other charts on the web browser.
The "HyperCube" Data model
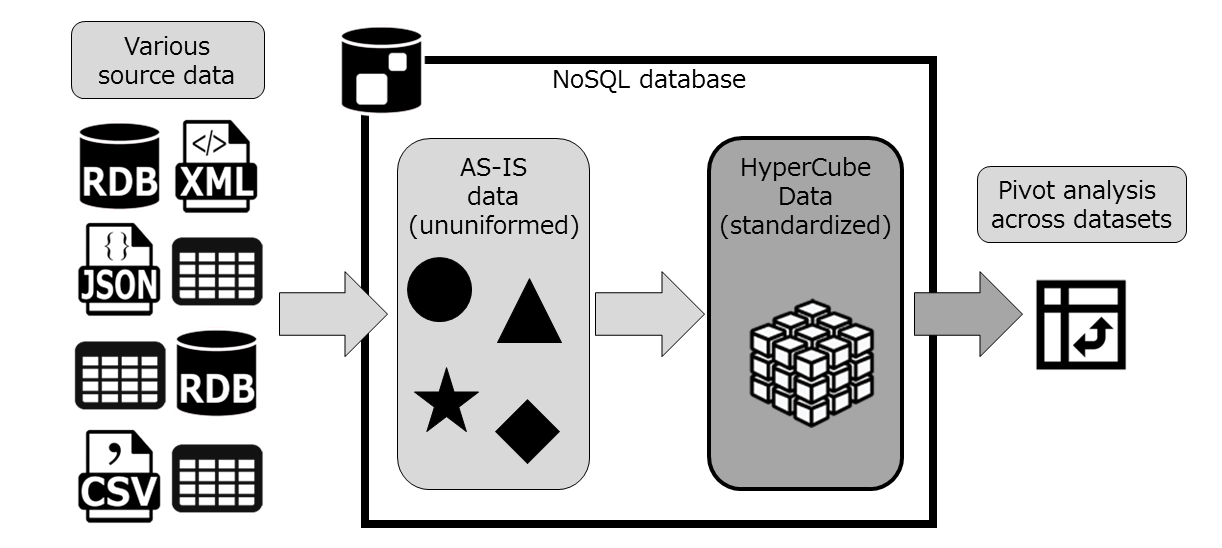
The "HyperCube" is a type of data model that NTTData is proposing in the NoSQL era. Setting some rules for source data with inconsistencies, and standardizing them to use the NoSQL database's pros the flexibility, and its strength in changes in data.
Creating the HyperCube from AS-IS ingested datasets on NoSQL database will make it possible to analyze across multiple datasets.
If analyzing only the Johns Hopkins University datasets, there is no need to create the HyperCube model, but as we go further into the series, we will be faced with multiple datasets and Analyzing across many of them. The HyperCube model will be useful in that situation.
Issue: Uneven Data Layouts, and Code Schemes
The data collected data silos are usually uneven in 2 places, their Data Layouts and Code schemes.
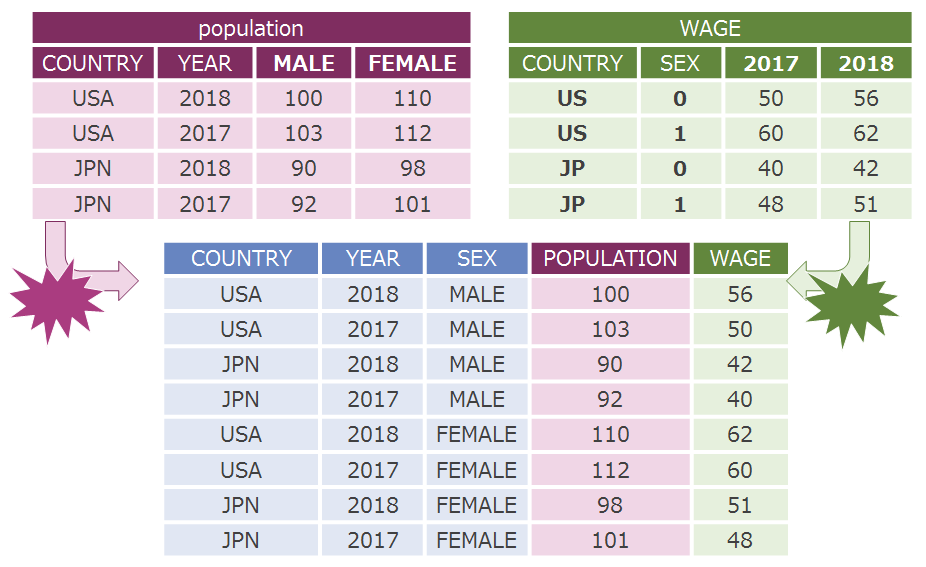
For example, the picture below shows the dataset "Population" in purple, and "WAGE" in green. The "population" dataset is expressed as follows: MALE, FEMALE columns describes gender, and year is expressed as YEAR. The WAGE dataset expresses gender as SEX, and the years as individual columns like "2017", "2018" and so on. This is a very typical example of a uneven data layout.
The Country column for the "Population" dataset has a 3 digit code such as USA or JPN, but the "WAGE" dataset only has a 2 digit code US, and JP, this is the example for an uneven code scheme.
It comes to realization that analyzing these datasets above will involve a tiresome step to clean the dataset.
HyperCube Data Layout
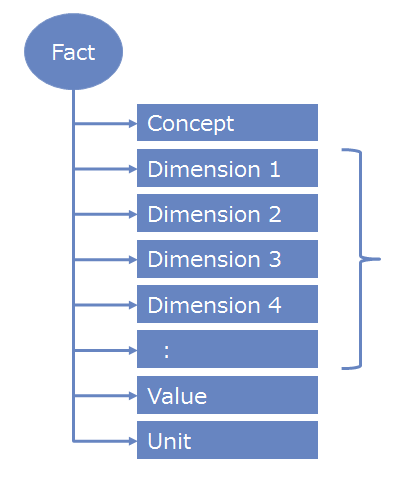
In HyperCube, uneven Data Layouts are managed and standardized by transforming it into a single "unified layout", such as the Fact data stated below.
-
- Concept
- Main value of the "Fact". A Single concept always exists per Fact.
-
- Dimensions
- The "axis". multiple dimensions can exist on one fact.
-
- Value
- The Value, one value per Fact.
-
- Unit
- The unit of the value. One per fact.
The HyperCube Fact data will be stored in a JSON format as below.
It is possible to express almost any type of data using the HyperCube Data model.
Understanding the terms Concept, Dimension, Value might be a challenge, but below example might be of help.
If the data is translated into a sentence and divided as below.
- 「~OF, IN」means the「Dimension」
- 「~THE」means the「Concept」
- 「~IS」means the「Value」
For example, a data on summary of accounts can be expressed as follows "THE Consolidated Revenue OF NTTData IN 2019 IS 2Trillion 2668Billion Yen".
if expressing Stock and Securities report it will be shown like "THE Location OF NTTData IN 2019/06/01 IS Tokyo-to kotou-ku".
The biggest trait of the HyperCube data model is the balance between Standardization and flexibility. By standardizing the layouts, It is possible to search across multiple fields that involves the 2 "Concepts" (ex. Location, revenue) and Dimension (ex. NTTData).
The "Dimension" fields can be added without a limit (one of the Strengths using a flexible NoSQL database). In the example before, "DimReported_company", "DimAccount_year", "DimJoinorSingle", "DimTime" are the dimensions used, and as more and more datasets are in a HyperCube format, more Dimensions will be added rather than defining the table and editing the content(also a strength of the NoSQL database).
This is the reason behind the "Balanced data model of the NoSQL era".
HyperCube code value
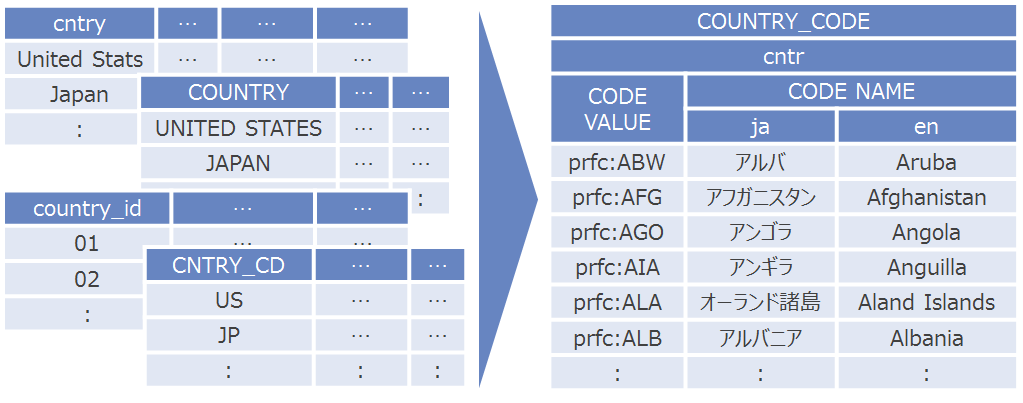
For the inconsistencies in the code scheme, HyperCube manages the code values in a single format. The reasons are as follows
- Define values that have same meanings
- Manage the name of Codes all in one place
- Handle global Code names.
For example, if the data “NTTData’s revenue” and “NTTData’s location” must be defined by the common item NTTData, meaning these items must be defined By the same code type. For defining the code types, a certain rule must be followed to keep Items in order(Organizing items by security codes, EDINET code, Corporate social security numbers, etc.)
By assigning code values(such as a security code number 9613) with labels that match the code, and managing master data in a single place, which prevents inconsistency in data like “NTTData Corporation” and just “NTTData”. It also will support systems globally when defined in other languages(Japanese, English, Chinese).
Summary: HyperCube, the flexible data model
This article was about the HyperCube data model, Standardizing inconsistent datasets and understand the positive effects of using a NoSQL database for this model.
Next article will show how to create HyperCube data using the Johns Hopkins University COVID-19 datasets.