(1) Ad hoc Ingestion, and usage of COVID-19 related datasets.
The "Easiness" of verifying a hypothesis, is key to Data utilization
Coming of this Digital era, companies are in midst of using not only their traditional data within Data warehouses, but "all sorts of data" to bring new insight to their business, or help companies cut costs. This "all sorts of data" meaning, for example, the log data of customer behavior, public data, texts, image data, and voice data. Analyzing these non-structural datasets is the key leading to new business ideas for the company, and finding tasks that is manually done, but can be automated. "Speed" is important to the information analyzed. Not only is Process speed of computers important, but what's more important is to cut down on the Operation lead time and provide fast "Easiness" of verifying a hypothesis.
For example, If someone were to come up with a new idea to improve efficiency of work. Before going ahead and developing the idea full-scale, it would be best to use fact data and verify the hypothesis so your sure of the results. To accomplish this verification, There might be operations that must be handled by different teams and divisions to get the data you need (which will take time); and once you get the data, it has to be cleansed and formatted to your needs; and finally after you have gone through all the effort asking around for the datasets, and cleaning the data, the results might not be what you have been looking for. This experience can be a big psychological hurdle, and sadly enough, happens on many occasions when working on Data utilization.
Now why does this happen? Mostly because it takes too much time preparing data before it can actually be used. It is said that when working on Data utilization, Cleaning, and preparing the data(also called data preparation) takes 80~90% of the Analyst's time throughout the whole development process.
This article will introduce an efficient way of data preparation for hypothesis verification using use cases.
Examples using COVID-19 related datasets
The COVID-19 virus is a global pandemic, and is affecting the economy, medical care, education, transportation, culture, and the community through out the globe. There are many types of COVID-19 related data open to the public from different organizations for example, the number of infected/deaths per community/region and number of PCR tests taken/tests proven positive. These data are reported via media, and used by analysts, combining other known data for trend analysis.
This Article will use this COVID-19 related datasets and collect, aggregate it with other types of data to find out what kind of problems that we face when using data, and how we solve the problem efficiently.
The details will be explained as we go further, but when dealing with COVID-19 related datasets to analyze, here are the main problems that surfaces.
- Datasets does not have consistence in columns
- The Date format is different by datasets (YYYY-MM-DD, MM-DD-YY).
- The Country codes are expressed differently ("United Kingdom", or just "UK")
As the examples above, to efficiently ingest and use the data that might change its schema often, increase its column, or data that we just can not understand, we use the power of NoSQL database, and its Schemaless nature.
The Output Image
From this point forward, we are introducing how to collect, prepare, and analyze the data, but the most important part of it is the understanding of the 「Goal of this actions」. So as the chef tells you what we are going to be served before we know its recipe, we will first show the readers what the output is from this Analysis.
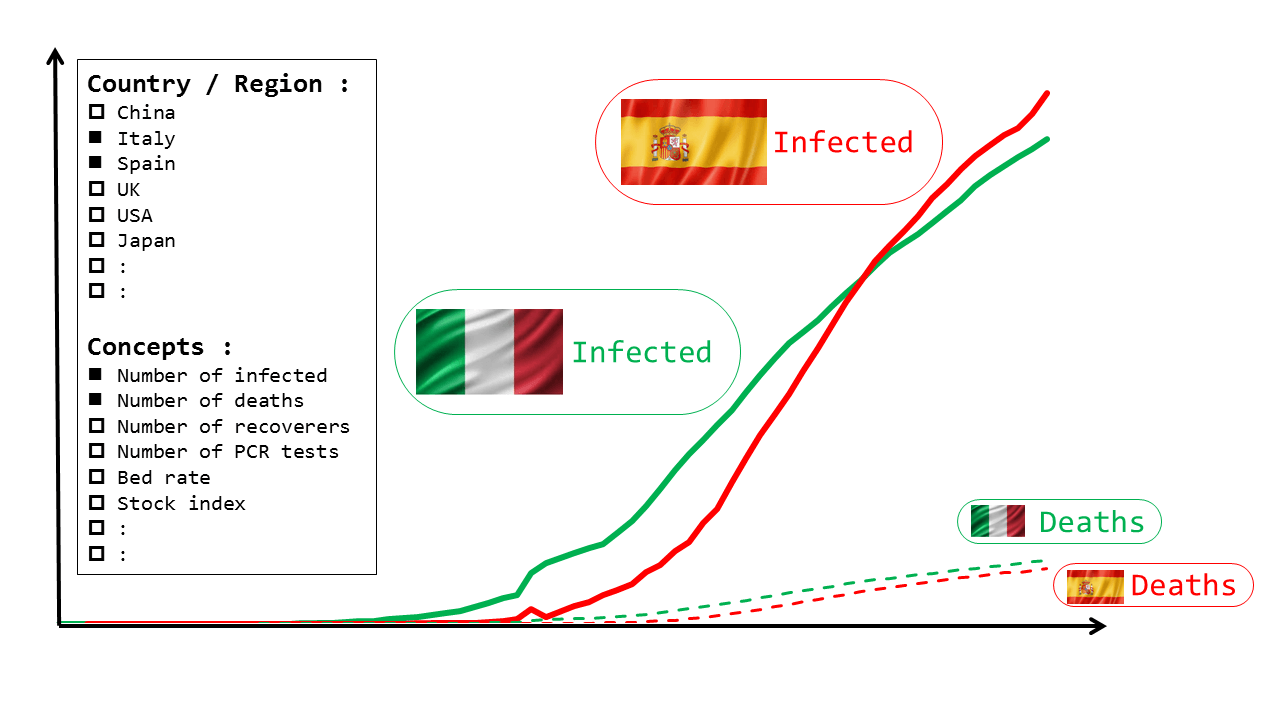
The first use case is looking at the data in chronological order. Selecting a few countries, Analyzing items, and to look at their change over time. For example, the below is a figure selecting {Spain, and Italy} as the country, and {The number of Infected, and death tolls} as the Analyzing item.
additionally, it will be best if the graph transcends the source data and can be plotted with other medical, and economical related datasets.
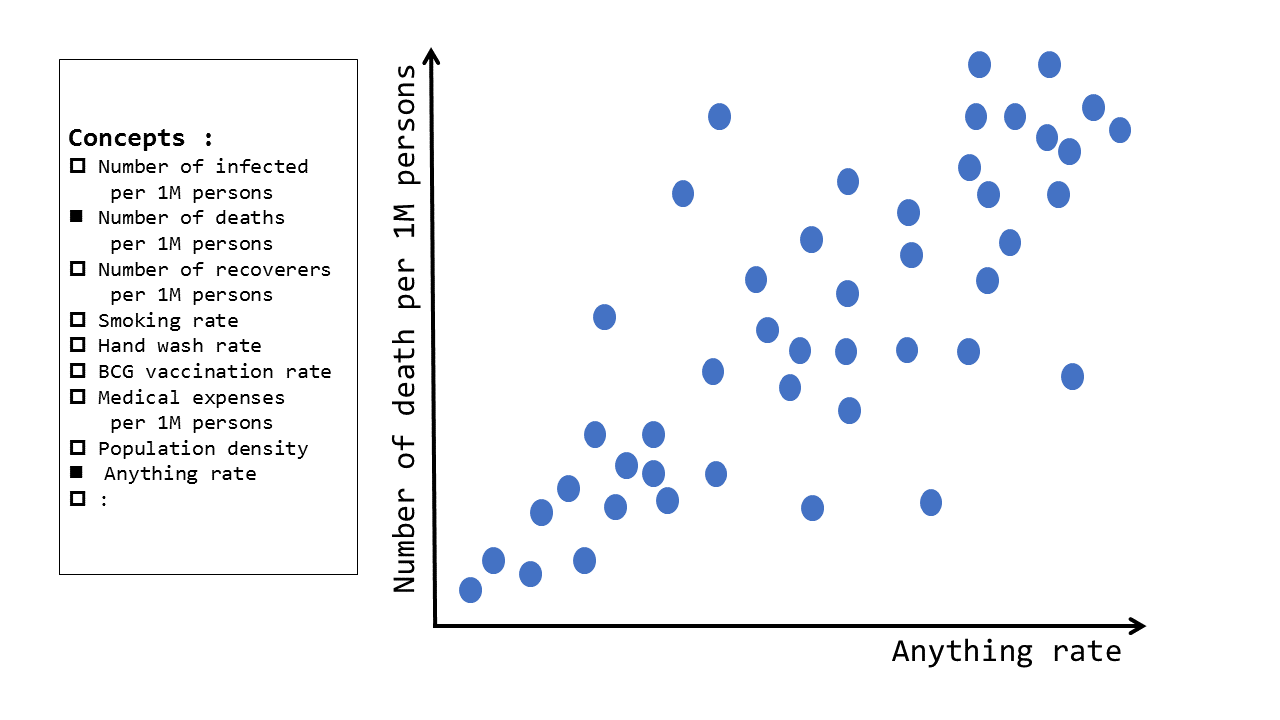
Another use case will be the 2-axis scatter diagram. As countries take nearly the same measures to control the Infection as every other country, there are grave differences in numbers of deaths, and the infected. The reason behind these numbers are not clarified but there are some statements made from the media as the below
- People who smoke are more likely to have severe symptoms
- It is likely that the symptoms get worse when having other underlying conditions such as diabetes
- Countries with habits of washing hands more thoroughly has a lower Infections rate
- Countries with mandatory BCG vaccination has a lower Infections rate
These interrelationship of the data is best seen through selecting of the 2 axis items of the scatter diagram.
We have developed a simple demonstration application with our solution.
Next: Introducing the "Recipe"
This Article shows "what kind of Analysis you want to do" with the COVID-19 related data.
beyond this time, we would like to explain the "how" of achieving the results.