(2)Ingesting Johns Hopkins University Datasets into database
The last article was about the overall image of collecting and analyzing the Covid19 datasets. This article will focus on the specifics of collecting and analyzing.
What is the Johns Hopkins University Dataset
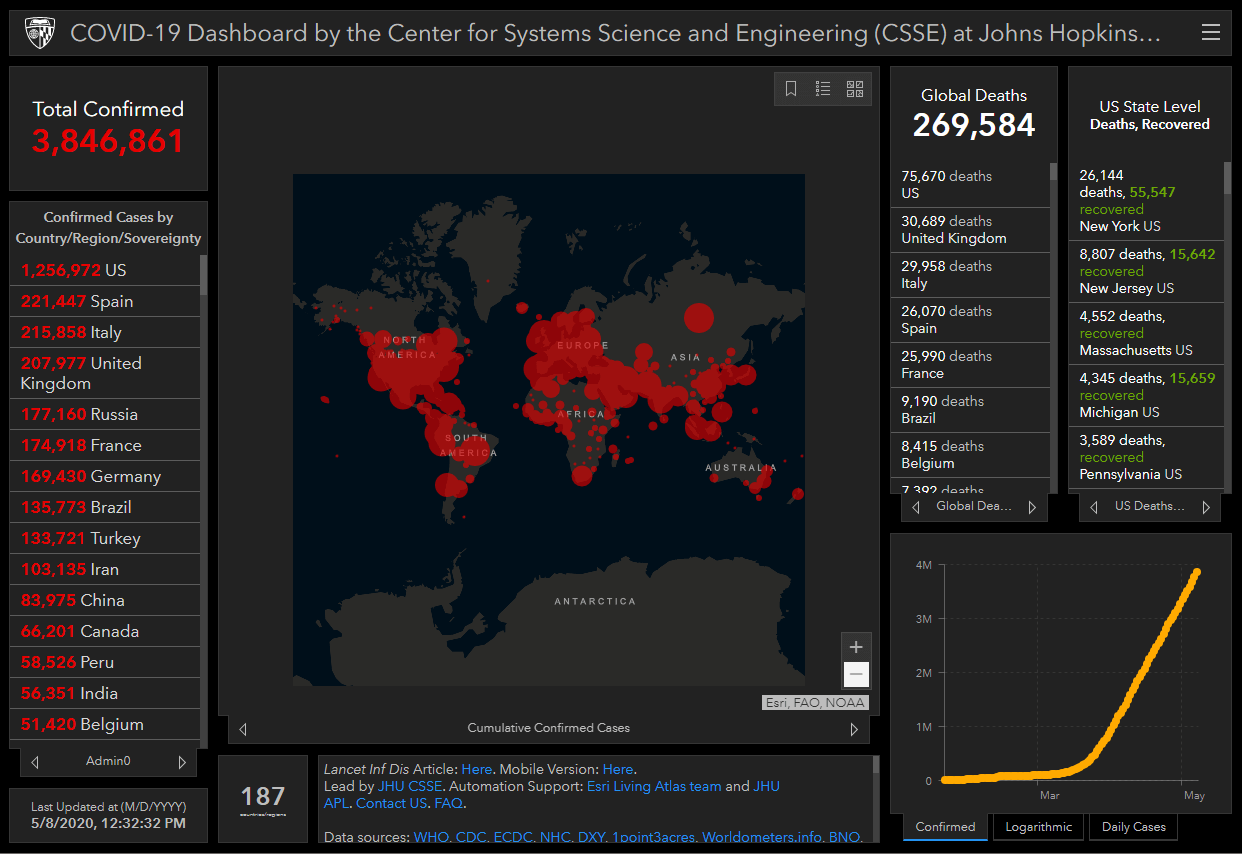
There are many organizations that provides Covid19 datasets. Within those organizations, Johns Hopkins University is attracting attention with its "COVID-19 Dashboard". This was one of the first source to provide the public with The number of Infected people starting in January, 2020 and, is accessed around 1 billion times a day, cited by media around the world.
Located in Maryland, U.S, Johns Hopkins University is known to having one of the best Medical schools in the World. The Dashboard above is created, and maintenance by the Center of Systems Science and Engineering (CSSE) of the same University.
The dashboard's datasets are gathered from several sources including the World Health Organization(WHO), and each country's public health centers. The datasets are automatically collected by Web scraping, and updated hourly. The datasets mentioned above can be seen in GitHub.
This article will Utilize the data available above.
Downloading the Infection information from GitHub
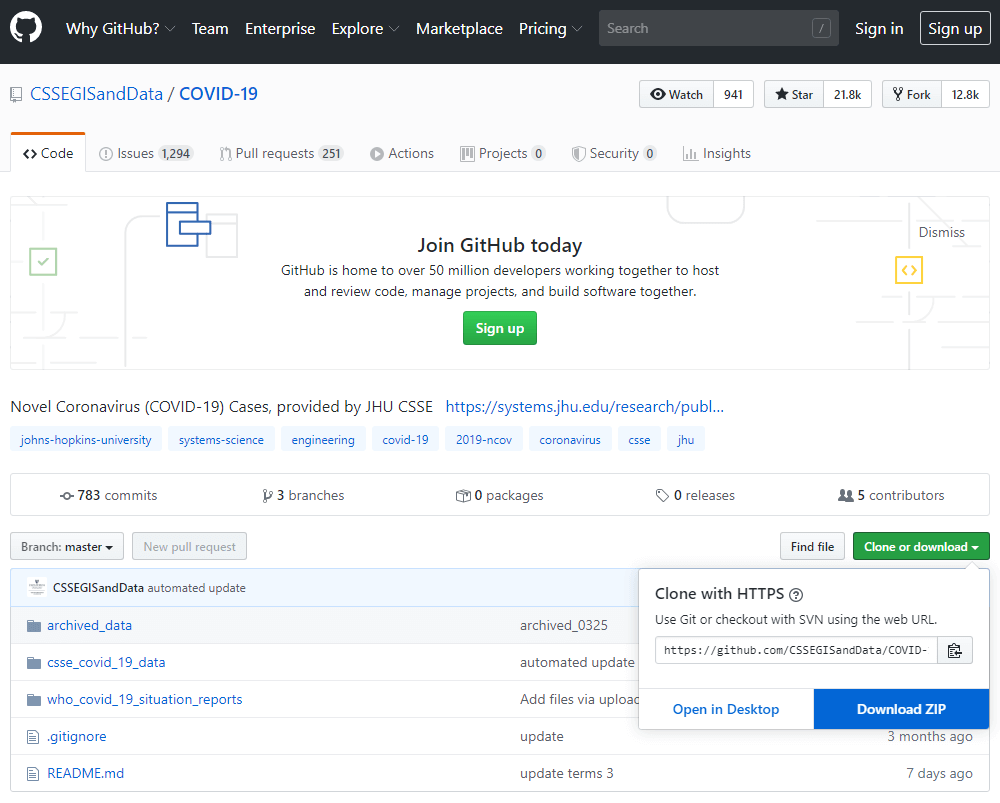
GitHub : COVID-19 Data Repository by the Center for Systems Science and Engineering (CSSE) at Johns Hopkins University
https://github.com/CSSEGISandData/COVID-19
Access the Link above to see the COVID-19 Datasets provided by Johns Hopkins Unversity(JHU). Read through the「README」and go right to the download.
Check The Downloaded Data
When downloading, the data shows up in a Zip file named「COVID-19-master.zip」. Unzipped, the data will be as shown as follows.
There are 3 folders and beneath it multiple sub-folders. We will be focusing on the folder csse_covid_19_daily_reports.
Within the folder, there are multiple CSV files named「MM-DD-YYYY.csv」. Each CSV is made and updated daily.
Opening the oldest file 01-22-2020.csv the content below. You will see that there is a header in the first line.
Adjusting the data in to a more visible format will be shown below.
| Province/State |
Country/Region |
Last Update |
Confirmed |
Deaths |
Recovered |
| Anhui |
Mainland China |
1/22/2020 17:00 |
1 |
|
|
| Beijing |
Mainland China |
1/22/2020 17:00 |
14 |
|
|
| Chongqing |
Mainland China |
1/22/2020 17:00 |
6 |
|
|
| Fujian |
Mainland China |
1/22/2020 17:00 |
1 |
|
|
| Gansu |
Mainland China |
1/22/2020 17:00 |
|
|
|
| : |
: |
: |
: |
: |
: |
There are 6 columns
- Province/State (Name of Province, State not all of the Countries are in the data at the moment)
- Country/Region
- Last Update
- Confirmed (Confirmed cases of the Infected)
- Death (Confirmed Death cases)
- Recovered (Confirmed Recovered cases)
Using these datasets will let the user gain knowledge of the number of people Infected, deceased, and recovered by country over a period of time.
The Data layout changes over time
Opening the files of the other dates, notice that the layout of the datasets are different. Comparing the Jan 22 data which has 6 columns to March 22 data which has 12 columns, there are differences in the number of columns.
Looking even closer to the data, the Jan 22 data's Last Update column changed the name to Last_Update by March 22 data (from Space between the words to an underscore).
As the above states, this datasets are changed in both the number of columns, and the column name over time.
If you can't figure out the layout beforehand, put it in a NoSQL database
Changes in data layout whether the increasing number of columns or the changes in column names is common within any systems in any business. The COVID-19 datasets are especially the case since the amount of attention it receives is high, and more and more information is added and revised on a daily basis.
So the frequent changes in the layout is unavoidable, but the fact that the types of columns that exist cannot be tracked or hard to understand is a problem to the people who uses the data.
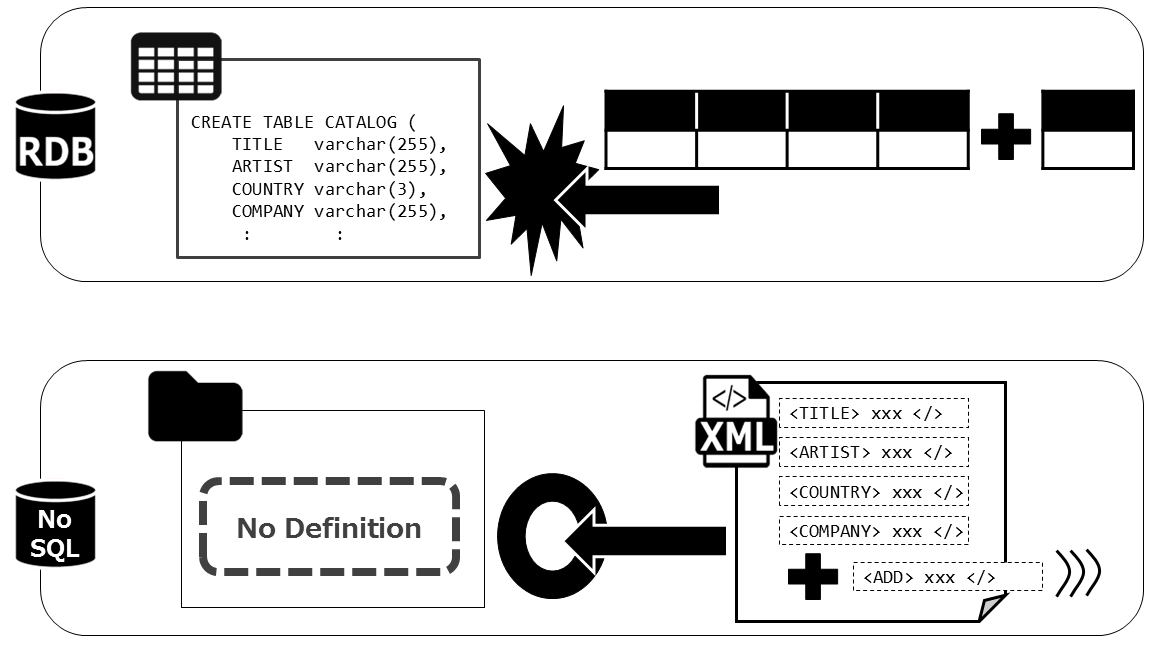
The reason this happens is because in a typical database, an RDB, the Table layout must be defined beforehand for the data to be properly ingested. When the user cannot understand, or the data changes often and cannot be tracked, the data is best left in the hands of NoSQL database. There is no need to define the schema of the data, and is easily searched within the database, and utilized.
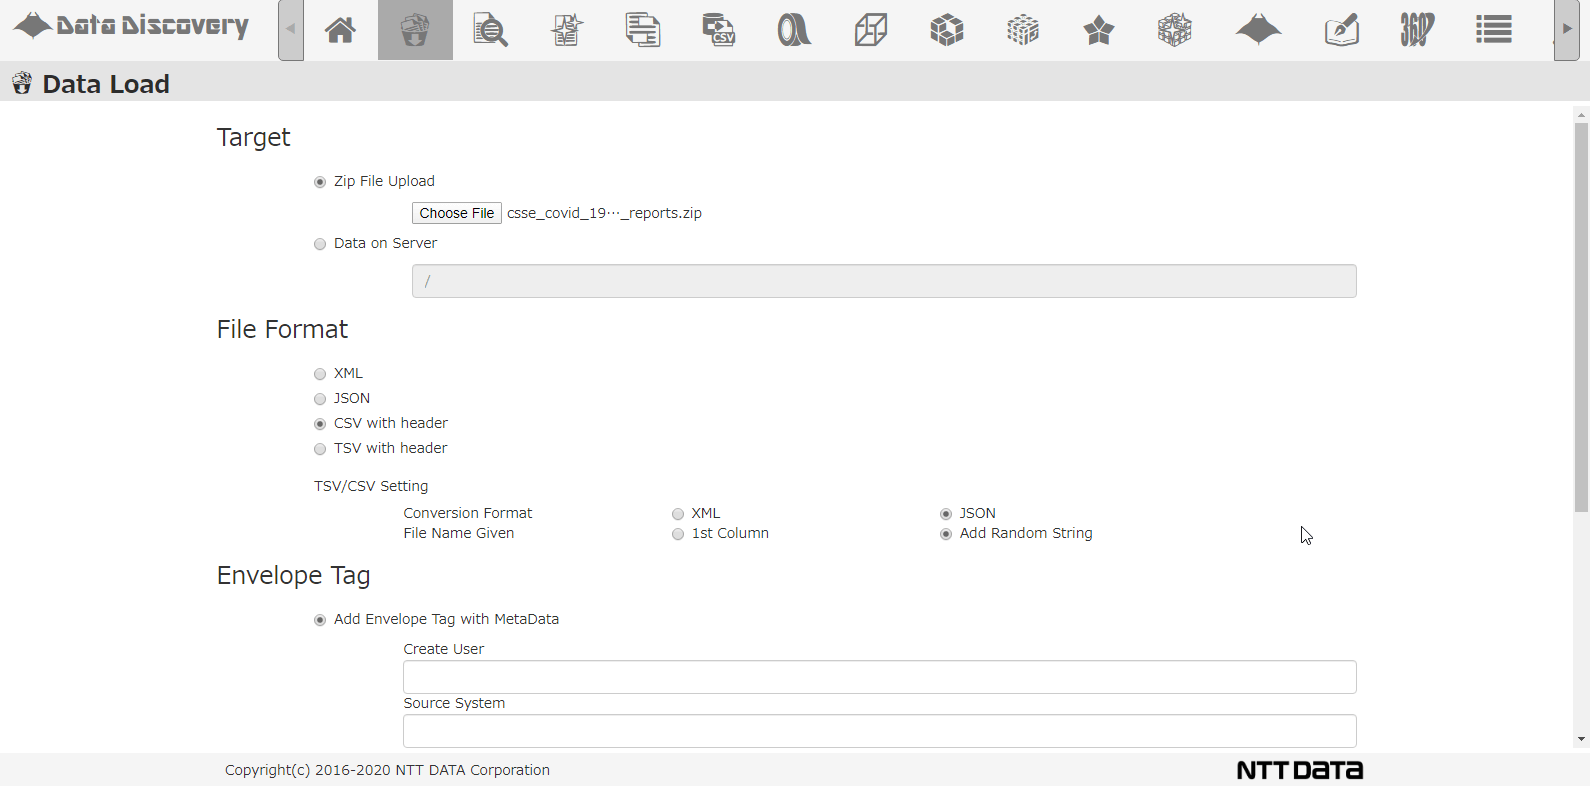
Shown below, our tool that we provided, 「Data Discovery」has a loading function that loads multiple CSV Zip files.
This is the CSV loading screen. Select the file from the dialogue, chose CSV, when loading to the DB, the CSV will be converted to JSON format.
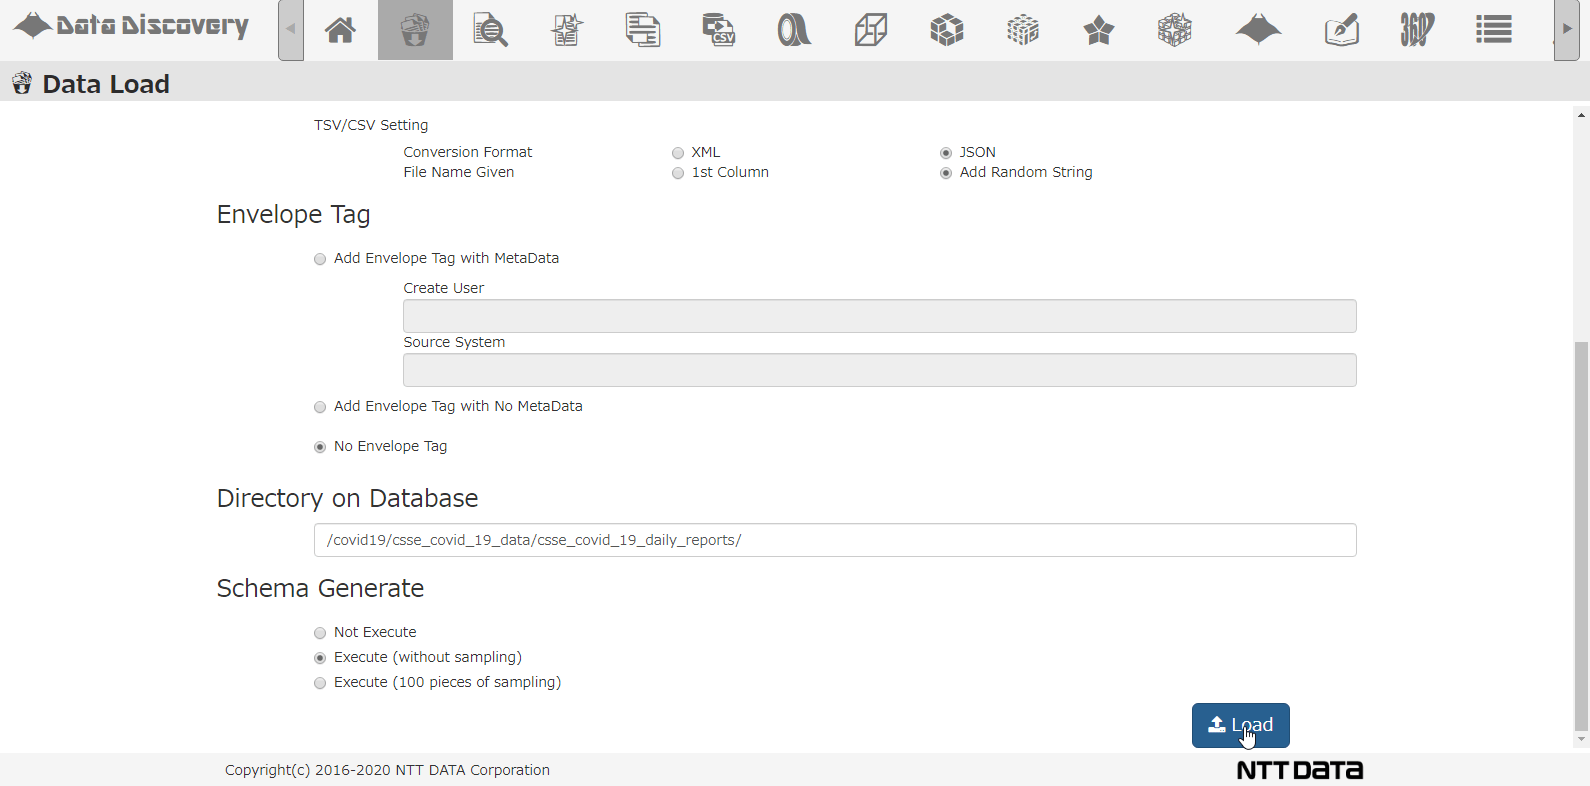
Select the DB directory to store the data, select the option for analyzing schema, and click the Load button.
This is all the operation needed on screen. Now the data will be registered to the database by batch processing, and the application will analyze the data and column to find out what type of data exists. The time it takes varies on the data size, but this time it took about 10minutes to process 86days worth of data.
When done in RDB, first, all the 86 days worth of data must be opened and verified of all the column types, then the data must be read to find out the data type. Next, based on the analysis, CREATE TABLE query must be written to define the table, and finally the data will be registered. In case of the NoSQL database, these steps are not needed(the database and the tool will do it automatically).
When CSV data are registered to a NoSQL database, a single row of the CSV will be converted to one JSON file.
For example, the records in the CSV below
will be converted to the JSON file below and registered to the DB.
Summary: The Strength of Schema-less DB against rapid changes in layout
Downloading the JHU data from GitHub took less than a minute, opening the data up and roughly understanding the data takes 10 minutes, and Ingesting Data in to the NoSQL database, and analyzing the schema takes 10 minutes. That totals the time it took to about 20 minutes.
This will explain how effective it is to use a Schema-Less DB when dealing with datasets that changes its layout.
Next, we will go further into cleaning the datasets registered in the DB